• Hi there and welcome to PC Help Forum (PCHF), a more effective way to get the Tech Support you need!
    We have Experts in all areas of Tech, including Malware Removal, Crash Fixing and BSOD's , Microsoft Windows, Computer DIY and PC Hardware, Networking, Gaming, Tablets and iPads, General and Specific Software Support and so much more.

    Why not Click Here To Sign Up and start enjoying great FREE Tech Support.

    This site uses cookies. By continuing to use this site, you are agreeing to our use of cookies. Learn More.

Solved Windows 11 not generating minidump files after BSOD/PC Freeze despite settings to generate said minidump files are enabled

Status
Not open for further replies.

ex0LL

PCHF Member
Oct 23, 2021
53
2
30
Like title says, I followed a guide on google on how to properly enable minidump file generation since, even after a clean install of Win11, I'm still experiencing issues on my PC where sometimes upon exiting games my PC just freezes.

On C>Windows there is no Minidump folder at all, I tried installing WhoCrashed to see if it could help but I'm still stuck.
I really wanted to fix this annoying freezing/crashing problems but I can't if minidump files aren't generated.

How can I proceed?
 
Hello, thanks for reaching out.

I already did, indeed, as explained in the instructions while searching for a solution on Google some days back.

This is my Paging File information on my OS drive that I manually set accurately following the instructions:

1701872371736.png


And this is how I set up my System & Recovery settings:

1701872515268.png


Even by double checking the instructions you sent me, everything seems to be in order; yet no minidump files are being generated.

Am I missing something?
 
Do you see a bluescreen at (BSOD) when it freezes? It's probably not a BSOD and therefore there will be no dumps. Not every crash is a Windows BSOD.

Let's test.

Way 3: Use Windows PowerShell to Trigger a Blue Screen of Death​

To use Windows PowerShell to trigger a Blue Screen of Death, you can use these steps:

Step 1: Click the search icon in the taskbar and search for PowerShell.

Step 2: Right-click Windows PowerShell from the search results and select Run as administrator.

Step 3: Type wininit into PowerShell and press Enter to run this command.

Then, the blue screen will appear with some error messages.

SOURCE

If successful, you should have some dumps.
 
Hey!

I have some updates:
the freezing occurred again after I quitted a game, both screens went black but PC was still "running".
It's like a power outage as received by the monitors but I can still see my PC turned on and "working".

After manually setting up the paging file and going for "Complete Minidump", after manually resetting my PC I finally found a MINIDUMP.DMP file in my Windows folder.

I tried opening it with WhoCrashed but it said that the minidump file was somehow corrupted?

So, since I was not satisfied, I downloaded Windows' WinDbg and ran a check.
This is the result of the check:

************* Preparing the environment for Debugger Extensions Gallery repositories **************
ExtensionRepository : Implicit
UseExperimentalFeatureForNugetShare : true
AllowNugetExeUpdate : true
AllowNugetMSCredentialProviderInstall : true
AllowParallelInitializationOfLocalRepositories : true

-- Configuring repositories
----> Repository : LocalInstalled, Enabled: true
----> Repository : UserExtensions, Enabled: true

>>>>>>>>>>>>> Preparing the environment for Debugger Extensions Gallery repositories completed, duration 0.000 seconds

************* Waiting for Debugger Extensions Gallery to Initialize **************

>>>>>>>>>>>>> Waiting for Debugger Extensions Gallery to Initialize completed, duration 0.109 seconds
----> Repository : UserExtensions, Enabled: true, Packages count: 0
----> Repository : LocalInstalled, Enabled: true, Packages count: 36

Microsoft (R) Windows Debugger Version 10.0.25921.1001 AMD64
Copyright (c) Microsoft Corporation. All rights reserved.


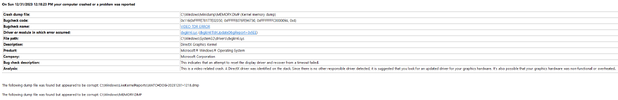
Loading Dump File [C:\Windows\MEMORY.DMP]
Kernel Bitmap Dump File: Kernel address space is available, User address space may not be available.

Dump failed with error code (0x0), and reports completion of: 45%

Last line in dump stack log: Dumping physical memory to disk: 45%


Symbol search path is: srv*
Executable search path is:
Missing image name, possible paged-out or corrupt data.
Unable to load image Unknown_Module_00000000`00000000, Win32 error 0n2
*** WARNING: Unable to verify timestamp for Unknown_Module_00000000`00000000
*** ERROR: Module load completed but symbols could not be loaded for Unknown_Module_00000000`00000000
Unable to add module at 00000000`00000000
WARNING: .reload failed, module list may be incomplete
WARNING: Mismatch between nt!KdDebuggerDataBlock and nt!KdVersionBlock - KernBase (Kernel Base Address)
Windows 10 Kernel Version 22621 MP (24 procs) Free x64
Product: WinNt, suite: TerminalServer SingleUserTS
Edition build lab: 22621.1.amd64fre.ni_release.220506-1250
Kernel base = 0xfffff804`3b600000 PsLoadedModuleList = 0xfffff804`3c2134a0
Debug session time: Sun Dec 10 11:54:29.182 2023 (UTC + 1:00)
System Uptime: 0 days 0:11:15.789
Missing image name, possible paged-out or corrupt data.
Unable to load image Unknown_Module_00000000`00000000, Win32 error 0n2
*** WARNING: Unable to verify timestamp for Unknown_Module_00000000`00000000
*** ERROR: Module load completed but symbols could not be loaded for Unknown_Module_00000000`00000000
Unable to add module at 00000000`00000000
WARNING: .reload failed, module list may be incomplete
Loading Kernel Symbols
Missing image name, possible paged-out or corrupt data.
.Unable to load image Unknown_Module_00000000`00000000, Win32 error 0n2
*** WARNING: Unable to verify timestamp for Unknown_Module_00000000`00000000
*** ERROR: Module load completed but symbols could not be loaded for Unknown_Module_00000000`00000000
Unable to add module at 00000000`00000000
Unable to read KLDR_DATA_TABLE_ENTRY at 00000000`00000000 - HRESULT 0x80004002

Loading unloaded module list
..........
WARNING: .reload failed, module list may be incomplete
GetContextState failed, 0xD0000147
CS descriptor lookup failed
GetContextState failed, 0xD0000147
For analysis of this file, run !analyze -v
GetContextState failed, 0xD0000147
Unable to get current machine context, NTSTATUS 0xC0000147
GetContextState failed, 0xD0000147
Unable to get program counter
No flat address for current instruction
?? ???
GetContextState failed, 0xD0000147
Unable to get current machine context, NTSTATUS 0xC0000147
GetContextState failed, 0xD0000147

From my ignorance, what I think I understand from this is:

Dump failed with error code (0x0), and reports completion of: 45%

Am I correct in assuming that perhaps I did not let my PC enough time to generate fully the minidump before manually restarting it?
 
is there a reason why you want a 52GB paging file?
Not really? Was just checking the optimal way to enable minidump so I just did it, since I don't wanna use my 250GB SSD for anything else but my OS.

Also, if you obtain an uncorrupted dump, upload it here using one of the file services, Google Drive, Dropbox, etc.
So, I don't have a minidump as for now since apparently that one problem didn't occur anymore so far, but something completely new just happened just while I was playing League of Legends: PC randomly reset all by itself in the middle of a match. For no reason.

I am trying to search for minidumps, but latest I can see in my Windows folder is the corrupted one I mentioned in a previous post.

Only information I can gather from the Event Viewer is this one:

1703254381651.png


I really can't wrap my head around this behaviour from my PC.
I thought that by fresh reinstalling everything as a whole would have fixed it.

Could it be at this point some fauly hardware?
I cannot seem to get a minidump or something that will shed light over the issue whatsoever, no matter what...
 

UPDATE

As of today, another "crash" happened. It wasn't related to exiting any game, as I simply let the computer idle and when I came back I found out both displays were turned off (as if power went off) but PC apparently was still on but unresponsive. This kind of crash also happened sometimes while doing whatever on my PC, but I am not sure wether it's related or not to the "exit game then crash" issue.

As of this time, minidump files were thankfully generated for the first time.
I tried running them with WhoCrashed and these are the reports:

REPORT 1

1704024544222.png

REPORT 2

1704024627996.png

"Analysis" string was too long to enter the screenshot, so here is what it says fully:

This is a video related crash. A DirectX driver was identified on the stack. Since there is no other responsible driver detected, it is suggested that you look for an updated driver for your graphics hardware. It's also possible that your graphics hardware was non-functional or overheated.

Now, I've double checked NVidia GeForce Experience for new driver updates and I'm all up-to-date. That goes without saying for me cause I ALWAYS update my GPU whenever I'm notified of a new driver update.

This is my GPU brand and model:
2047MB NVIDIA GeForce RTX 3080 (EVGA)

Temperature seem normal everytime I check with HWMonitor.

Could it be at this point that my GPU is defective or non-functional, as a possibility stated by the report?
Is there anything else I can try before given it for gone?

Thank you so much for your support as always.​


Attachments

  • 1704024576671.png
    1704024576671.png
    52.6 KB · Views: 0
I also wanted to add, if it can be of any help to the cause, that thanks to the amazing support of @phillpower2 I was notified of how incorrect my overall PC setting up was in terms of OS installation and drive, aswell as driver installation order (MOBO>CPU>GPU>Windows Update).

So, since I recently fresh installed my whole PC after the experience with another issue and problem that you can check out in this post , I'd say that there's no need to generally format my PC or fresh-reinstall OS as a possible solution to the problem.
 
Hey, thanks for reaching out again.

This is what I've done:
  1. Download and install DDU;
  2. Download the latest NVidia Driver from the official website;
  3. Disable my internet connection;
  4. Restart PC into Safe Mode;
  5. Run DDU and remove NVidia drivers using the "Clean and Restart" option;
  6. Install the NVidia GeForce Experience + Drivers again;
  7. Restart my PC;
  8. Re-enable my internet connection.
Now, it's worth nothing that, as you can see from my Speccy snapshot, I use two very different monitors as primary and secondary ones, the one being and ultrawide with 144Hz and the second one being a standard with 60Hz.

Since I've been having problems while gaming/having a full-screen/borderless full-screen application on my primary monitor and running YouTube/other media programs on my secondary monitor in terms of FPS/stuttering, I tried to follow a guide suggesting to scale both display performance on GPU rather than the display itself.

Things improved althought they did not get a true fix, but sometimes I still can notice some funny stuff between the monitors.

Could this be a problem?
Should I not change this kind of setting?
 
Status
Not open for further replies.